Designing Science-Based HR Product.

Problem

  • No comparable solution existed for such kind of product elsewhere. Due to the high complexity of data provided by the product, the data was difficult to interpret.
  • Therefore, potential customers had significant difficulty understanding the benefits of the product.
  • That's why each new customer needed in-person onboarding to understand how to use the provided data in various contexts.
  • General poor usability and accessibility.


Process

  • I needed to transform the company into a research-centric organization by conducting usability testing and in-depth interviews.
  • It was necessary to initiate and maintain regular workshops with the science team.
  • I had to rebuild the information architecture and UI from scratch, while preserving core aspects of the current product and process that actually worked well.


Solution

  • A highly standardized onboarding and dashboard were essential - incorporating familiar patterns for users was crucial, as understanding the platform and its benefits already posed enough complexity.
  • Instead od showing bunch of charts and numbers, we have defined set of general questions (such as "Which employee may want to quit?" or "Which employees are at the highest risk of burnout?") that the platform could answer for its customers. This approach shaped the way insights and outcomes were presented on the platform.

Result

  • Users could begin using the product without in-person onboarding.
  • Onboarded users naturally explored other parts of the product (beyond those they initially came for), which led them to adopt more use cases.
  • Clear insights significantly helped potential customers understand the value delivered by the product.

My role

I was the only and key designer in the company. I was in role of unicorn designer.

Key people

Igor Kubíček CEO
Samuel Nvota Head of Product

Timing

Feb 2022 to Feb 2023

Company type

Early-stage startup, up to 20 employees

Before

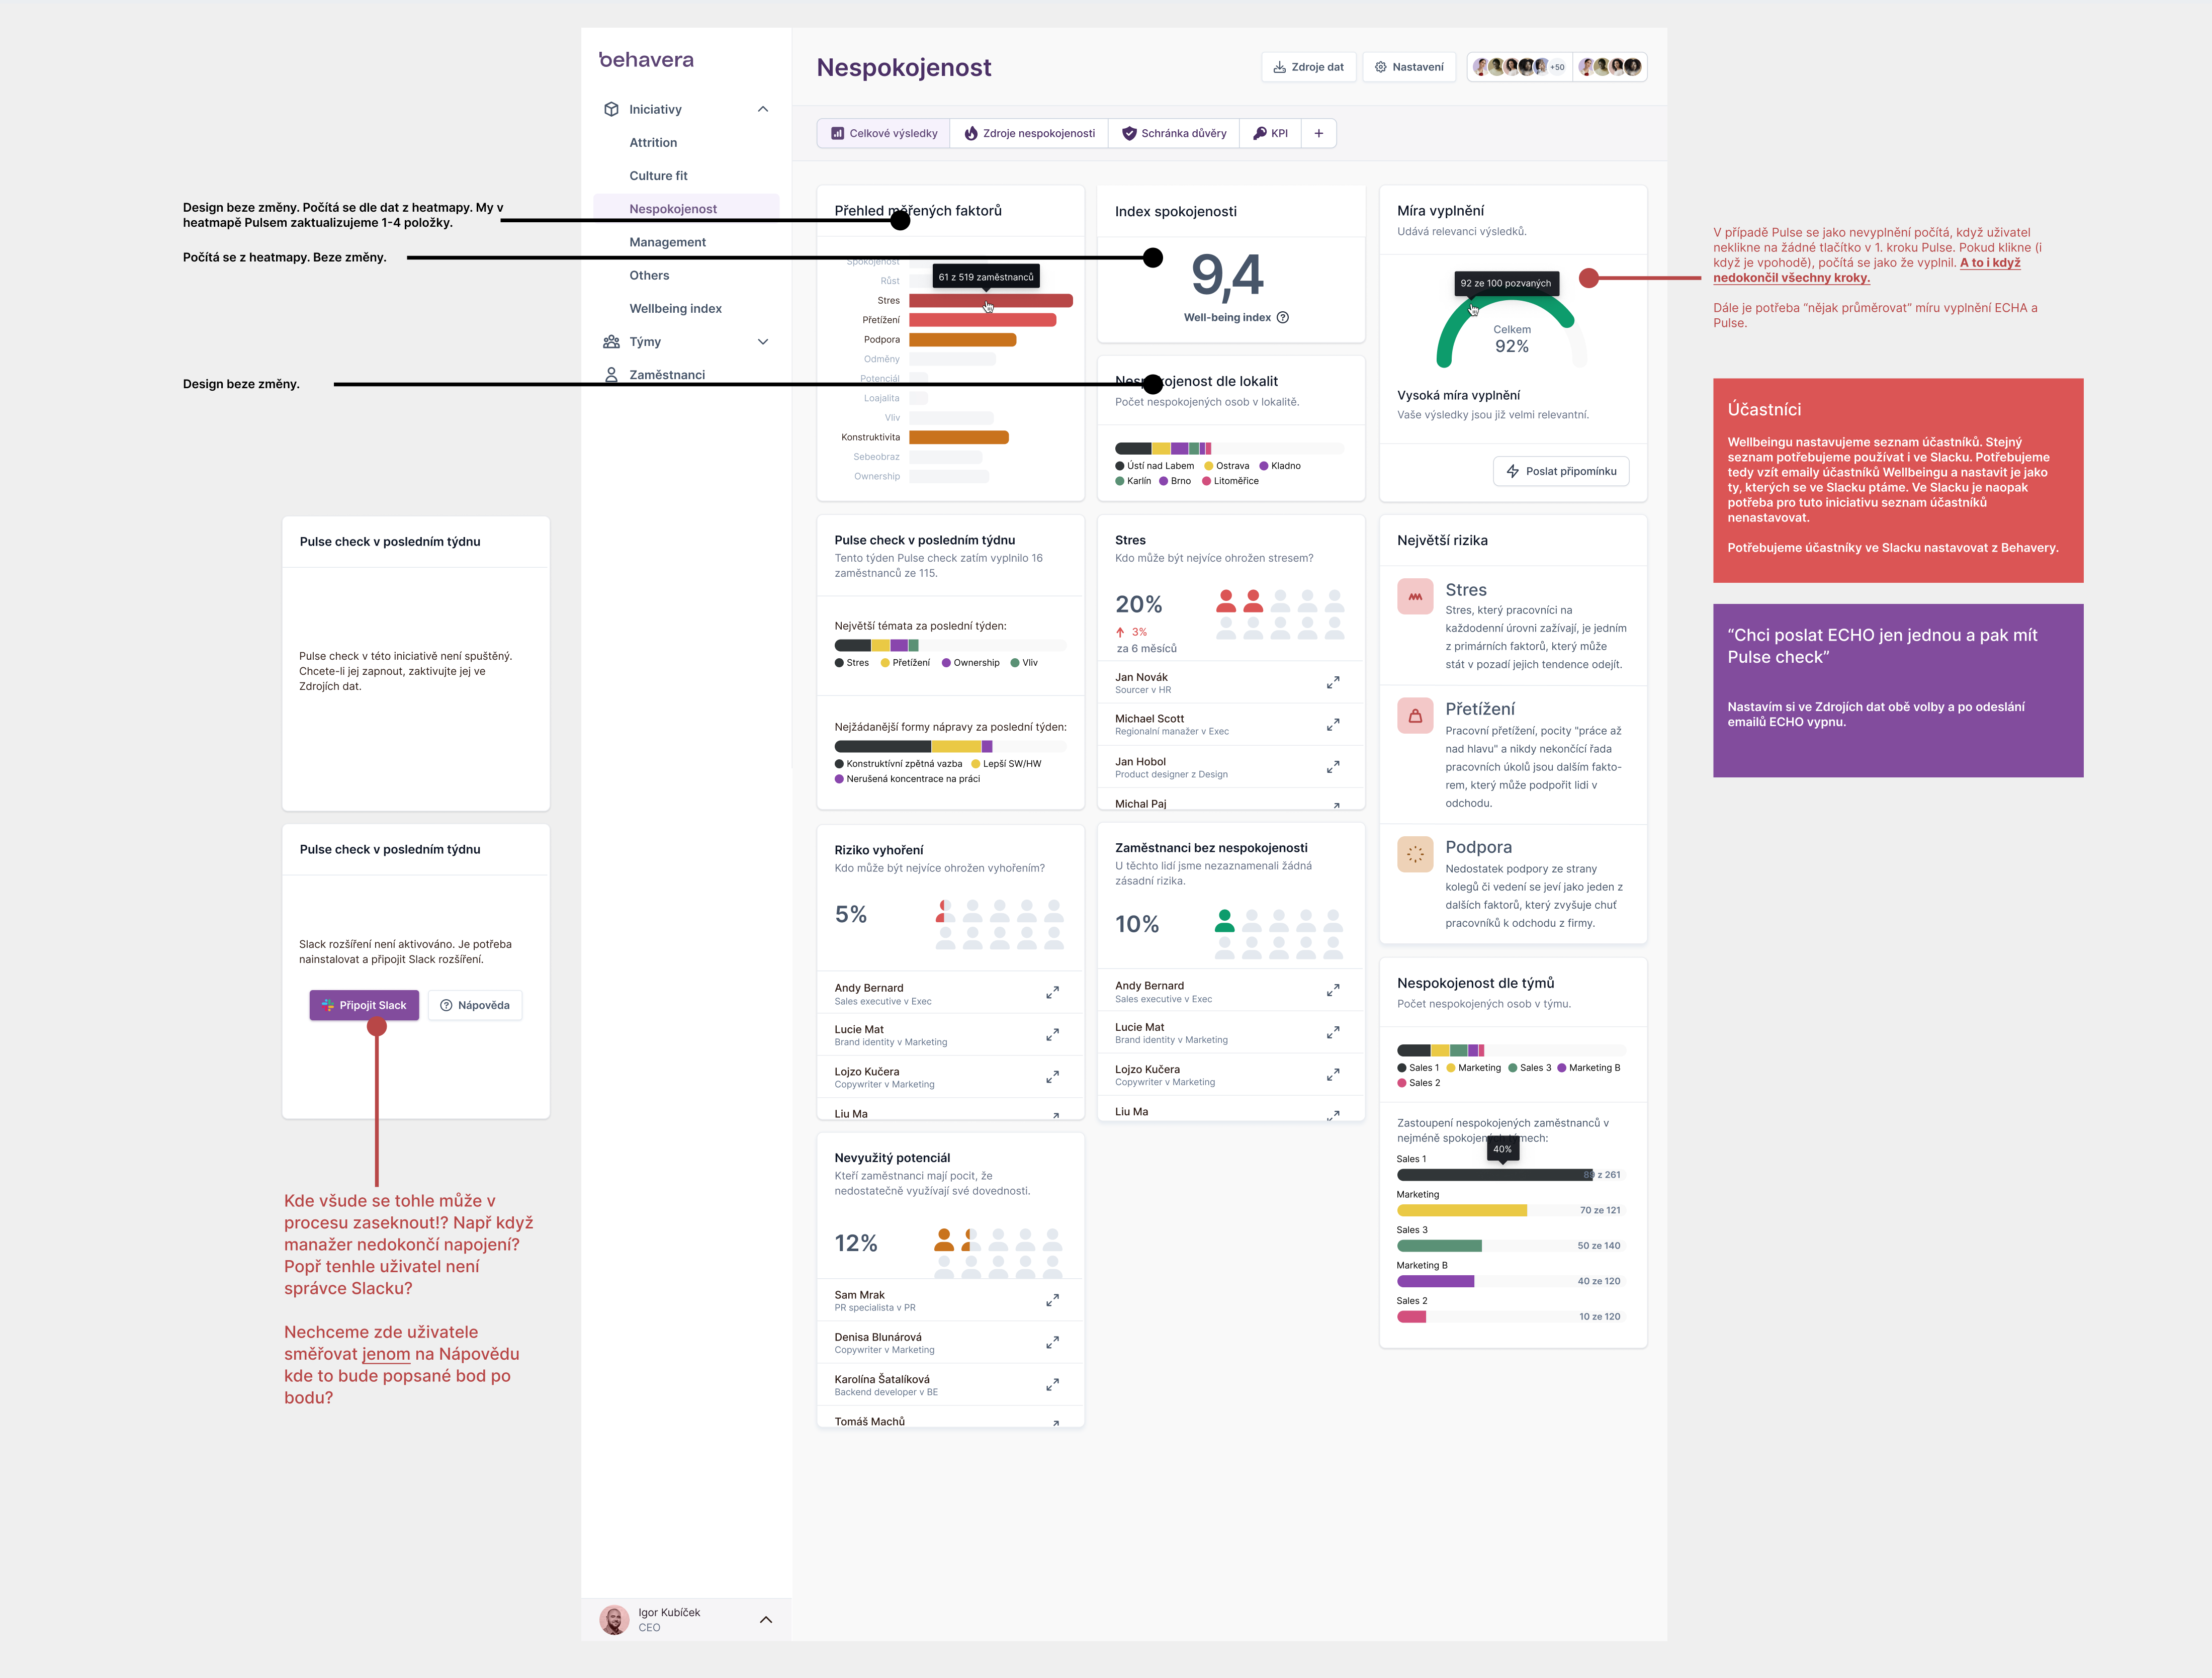
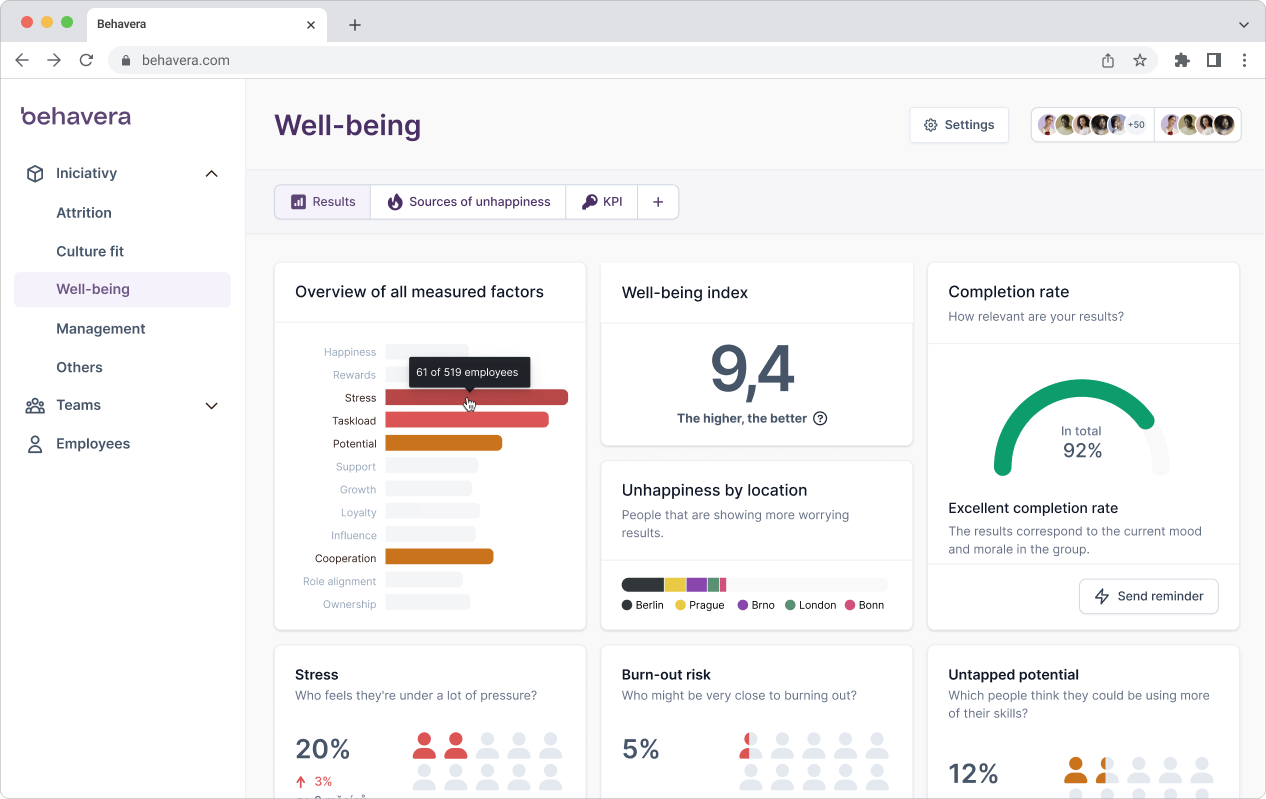
User needs to know how to read and interpret relatively raw data.

After

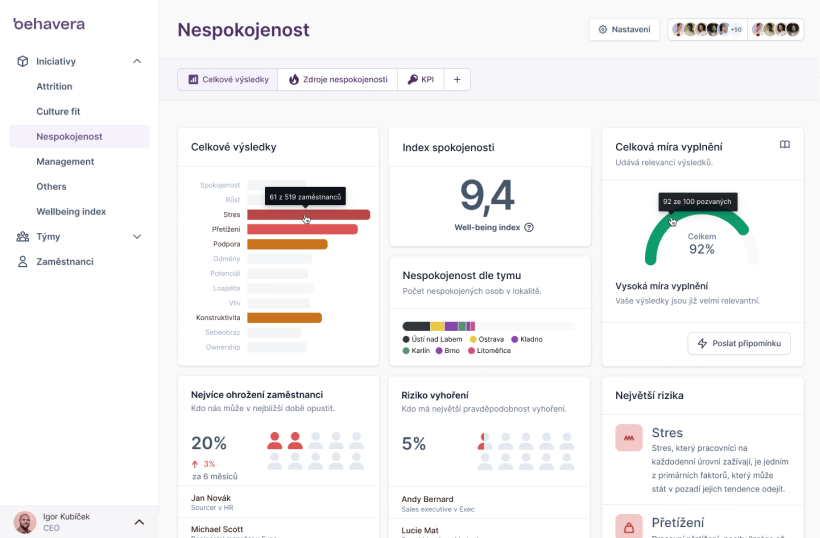
All data are interpreted and sorted by Epics.
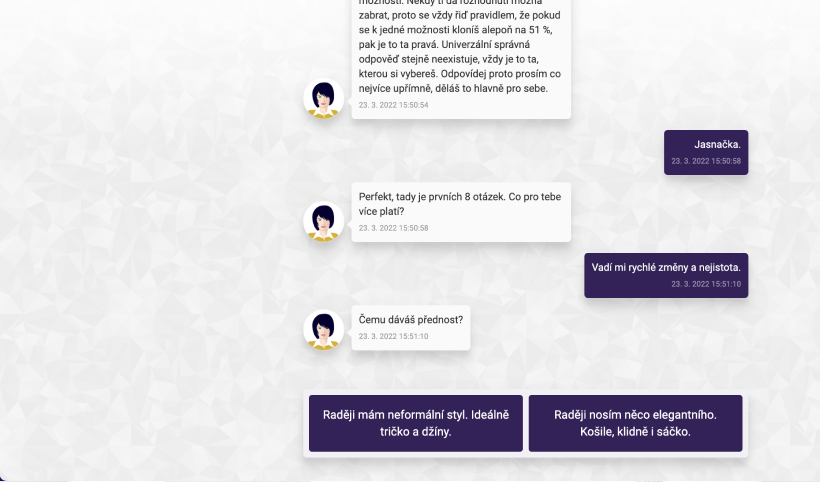
Before

MVP of chatbot

After

One question at the time, progress information, authority information.

Sketches & Results

Images illustrating the process, artifacts and outcomes.

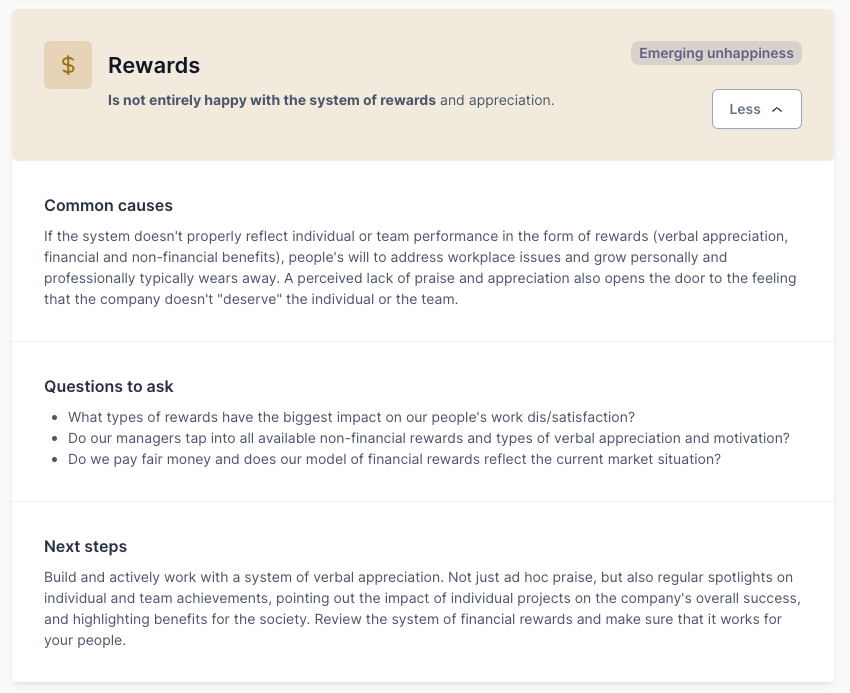
Single dimension of Well-being assessment for single employee.
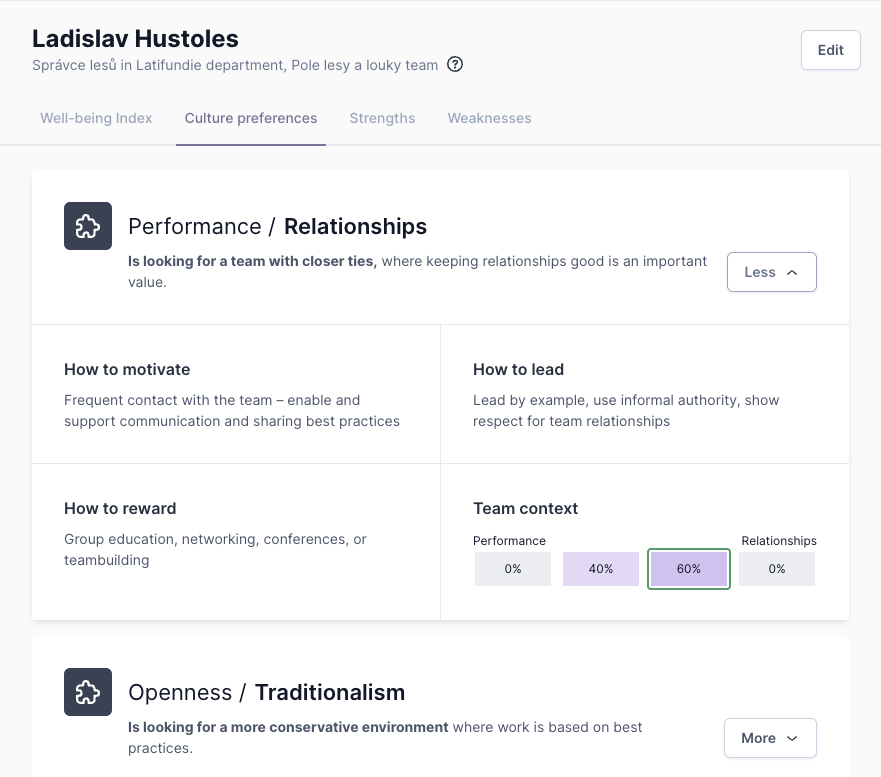
Outcomes of Culture fit assessment for single employee.
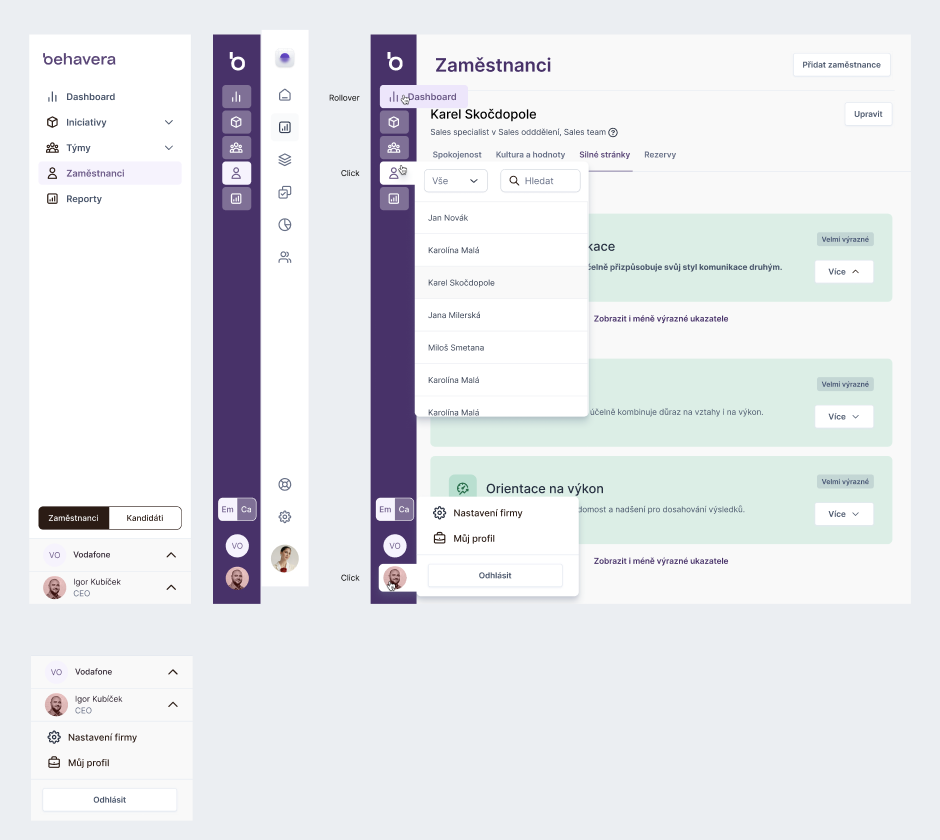
Responsive menu defined for developers.
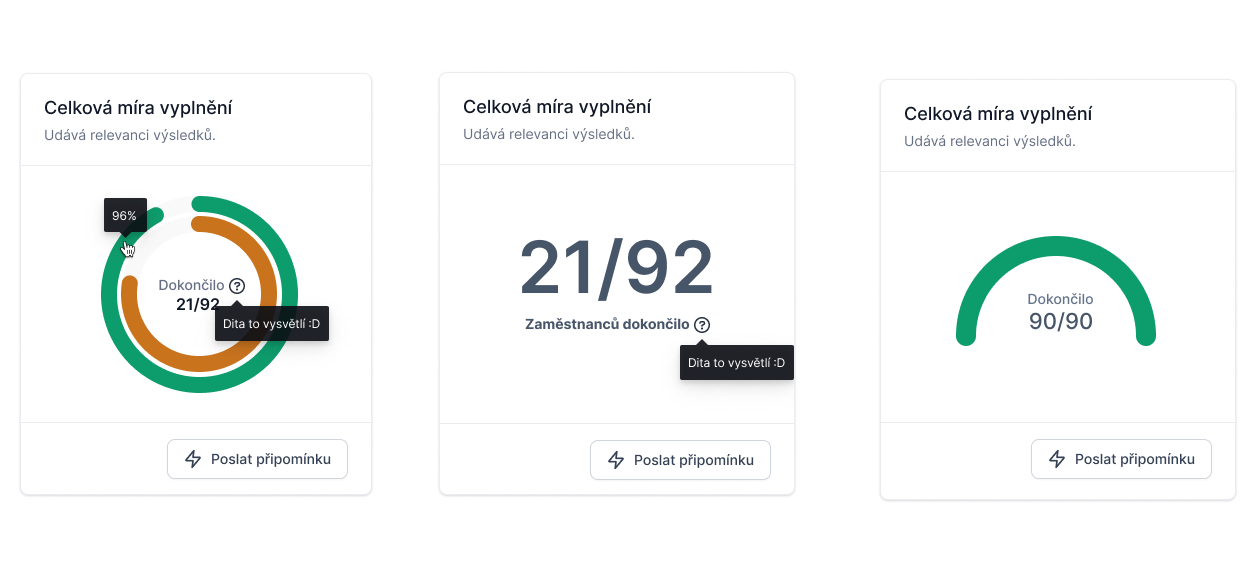
Various states of widget presenting fill rate of assessment.
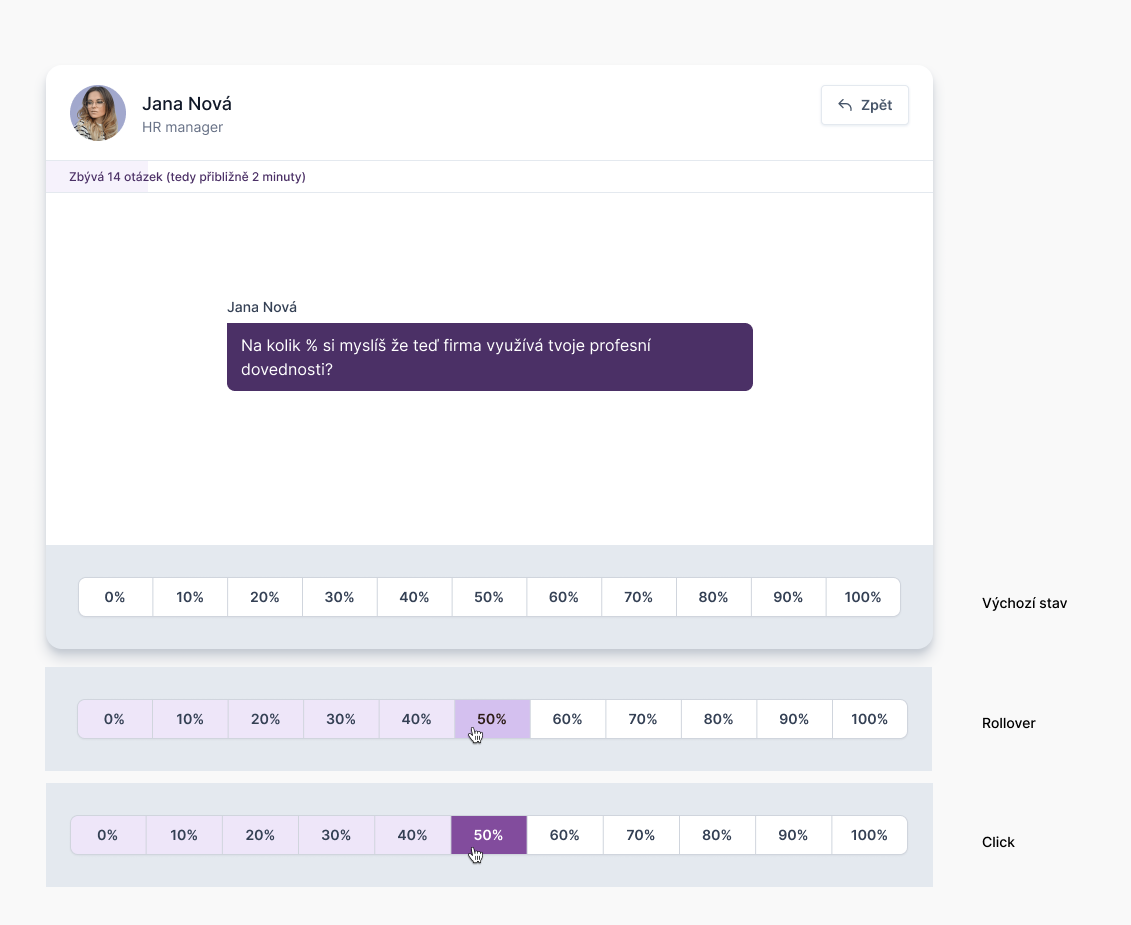
Chatbot for employees with interaction
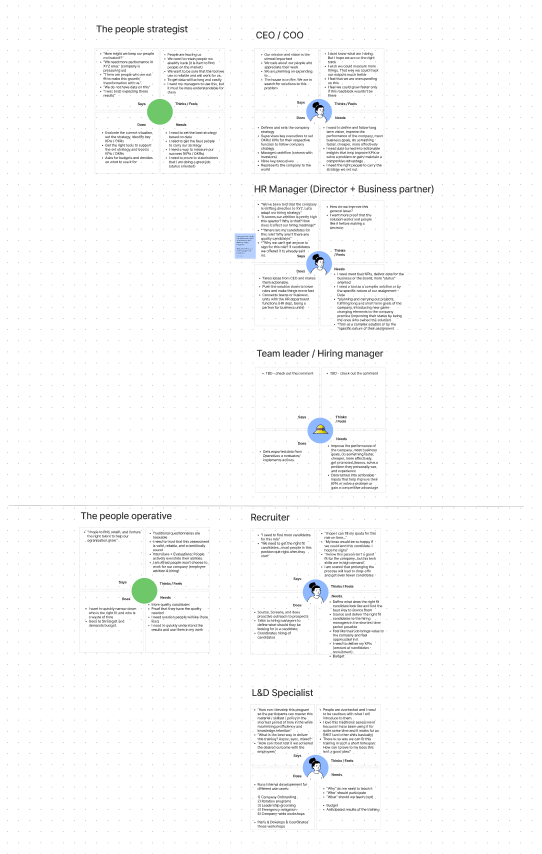
Defined personas
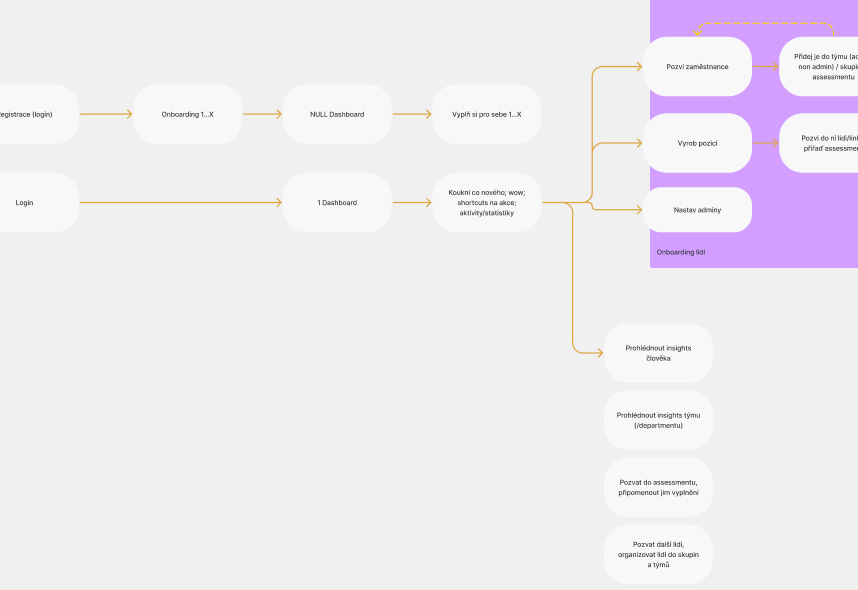
Part of general flow
arrow-up icon